Hey folks, so, just a quick one tonight. We ran across an interesting bug on Anchor Tab awhile back that I finally got around to looking at. So, to start, on Anchor Tab we have this magical chart that shows you your views and submits for the last seven days. Presently, mine looks something like this.

Yes, I have a very sad subscribe rate. Then again, most of the people who read this blog are friends who catch my posts via Facebook or Twitter, so that’s to be expected for someone in my sector, I guess.
The graph you see above is drawn with the brilliant Chart.js library. Honestly, we started out beta testing with a test version of Highcharts, but couldn’t afford the license. Then we found this, and it’s awesome. Go check it out.
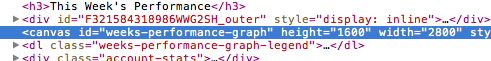
Anyway, Justin was reporting issues on his Retina MacBook Pro. The graph was appearing much larger than it should and breaking the page. Today, on a wild hare, I decided to check it out on my retina iPhone to see if I had the same issue. Sure enough, I did. So I hooked her up to my computer’s web inspector and found this in my DOM:
Somehow there was logic in place to quadruple the size of the canvas in the event you’re on a retina screen. (WAT?) Not sure what’s up with that, but the fix, for me, was to manually set the width and height to their correct values in our CSS file and add a “!important” onto the end of each rule so they overrode the width and height set on the element itself.
Figured I’d go ahead and put this out here, in the hopes of saving someone else in the future a bit of time.
Cheers,